
Public evidence can support a disciplined review of Aave’s product, on-chain activity, search and governance surfaces. It cannot show whether a campaign caused deposits, retained users or profitable growth. That distinction matters when a large protocol becomes the benchmark for a smaller team.
I reviewed Aave’s public product documentation, FAQ, governance material and protocol dashboards as an outside analyst. The scorecard below measures evidence coverage, not business performance. Where a surface needs private analytics, I mark it unknown rather than infer a result from TVL, token price or social activity.
The practical result is a useful public audit with clear limits: a reader can see what Aave makes observable, what a public dataset can establish, and what a growth team still needs to instrument before allocating budget.
What Aave does and who the product serves
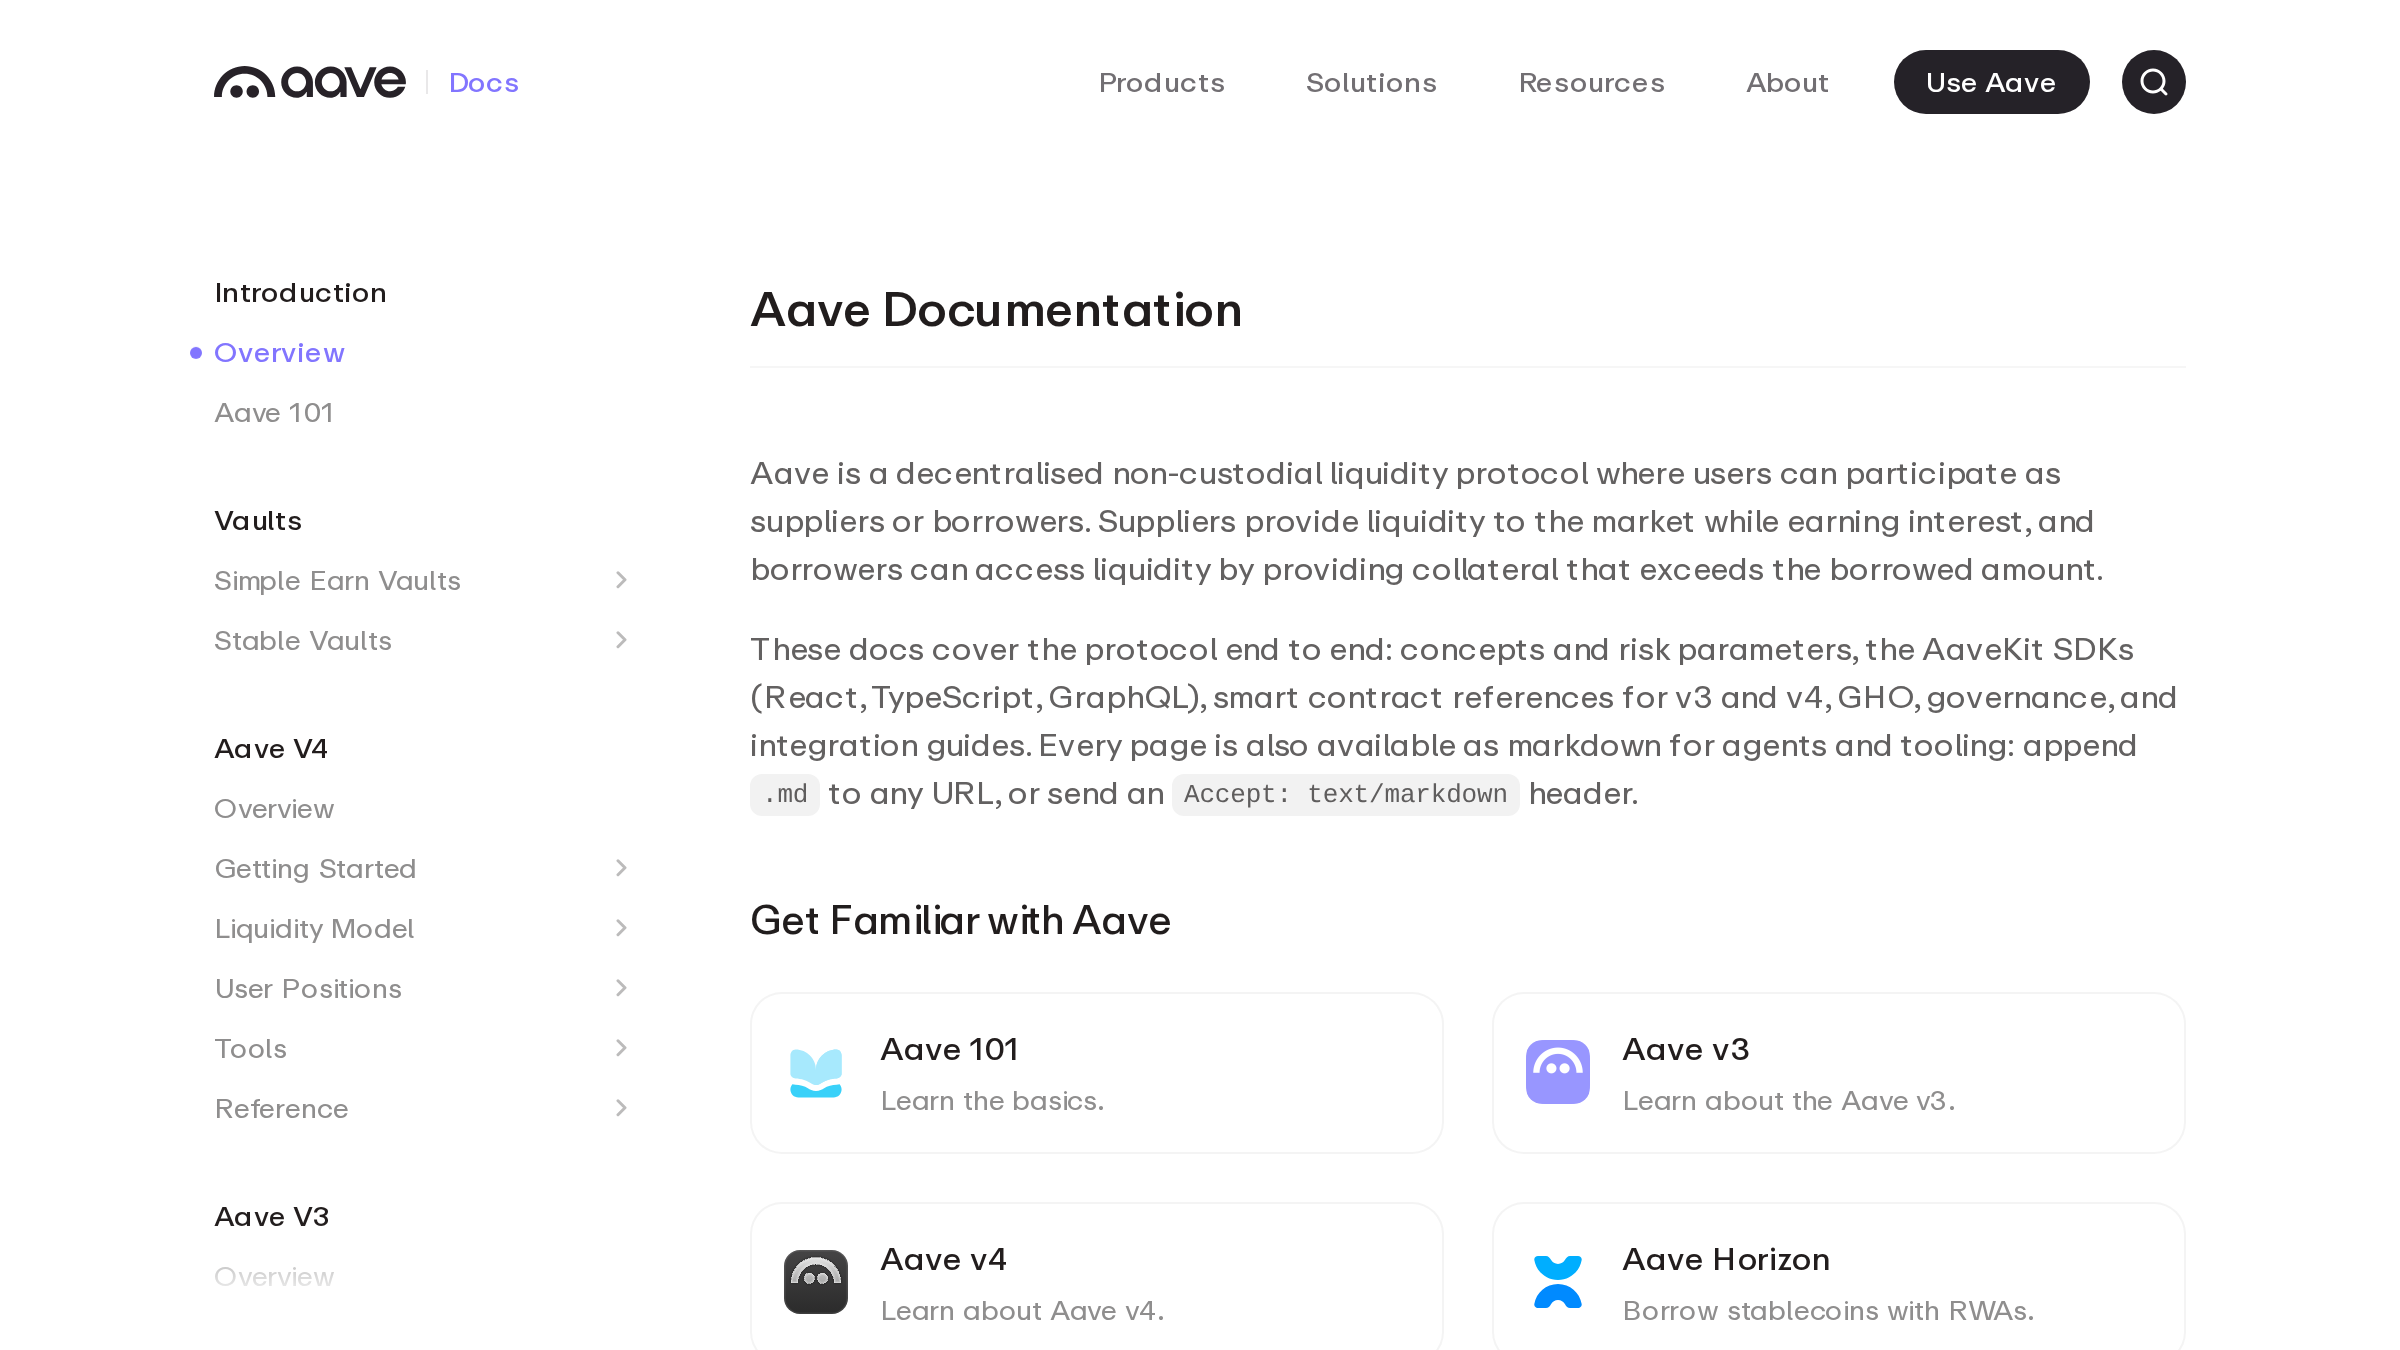
Aave describes itself as a non-custodial liquidity protocol. Suppliers provide assets to markets and can earn interest; borrowers access liquidity by posting collateral. The official documentation covers protocol concepts, risk parameters, developer tools, governance, GHO and integrations. This gives an analyst a strong view of the product surface and technical routes into it.
That is evidence of product breadth and documentation coverage. It is not evidence of how many visitors understand the offer, how many connect a wallet, or how many become repeat suppliers or borrowers. The public interface and documentation describe what a user can do. They do not expose the full journey from first touch to sustained use.
For a broader measurement frame, I also explain which DeFi growth KPIs deserve a place in a dashboard. The same rule applies here: define the event and denominator before comparing outcomes.
The distinction is especially important in DeFi. An Ethereum address can represent a user-controlled account or a smart contract, and one person can control more than one account. So an address is not automatically a person, a user or a customer. If a person changes addresses, address-level records can split activity; if a contract aggregates actions, records can combine activity. These are measurement limits, not claims about Aave user behavior. Ethereum account documentation explains the difference between account types.
Aave growth audit scorecard: six public evidence scores
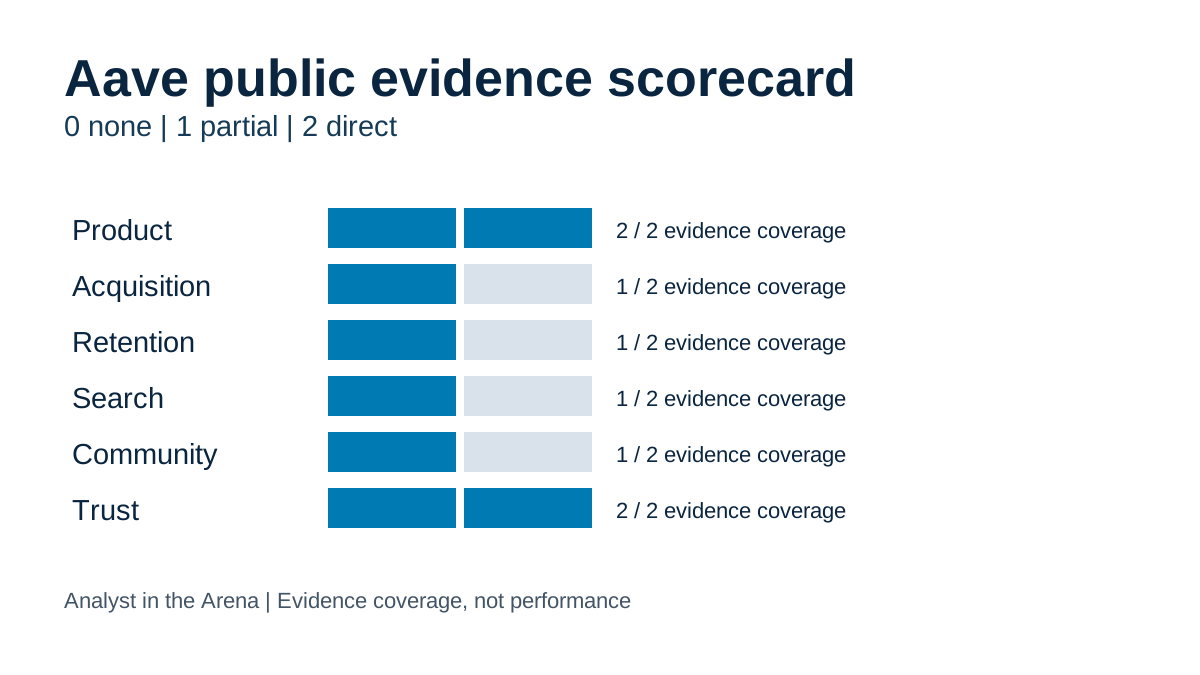
I use a simple evidence scale. A score of 2 means a public source directly exposes the surface being assessed. A score of 1 means there is a partial proxy or description, but important parts remain invisible. A score of 0 means the reviewed public material does not establish the surface. These are evidence-coverage scores, not grades for Aave’s performance.
The six criteria are product, acquisition, retention, search, community and trust. I mark an item “unknown” when the available public sources cannot support a reliable score. Unknown is a valid audit result. It prevents a visibility gap from turning into an invented weakness.
| Surface | Evidence score | What public evidence supports | What remains unknown |
|---|---|---|---|
| Product | 2 | Official docs describe supplier, borrower, risk and developer surfaces. | Task success, usability friction and conversion by entry point. |
| Acquisition | 1 | On-chain activity and public interfaces are observable proxies. | Channel attribution, campaign cost and incremental acquisition. |
| Retention | 1 | Repeat on-chain actions can be queried with a defined method. | Person-level cohorts, churn reasons and retained value by source. |
| Search | 1 | Documentation and help content are publicly inspectable. | Search impressions, rankings, click-through and assisted conversions. |
| Community | 1 | Governance discussions, proposals and votes leave public records. | Representative participation, contributor journey and community-led conversion. |
| Trust | 2 | Risk documentation, governance process and public protocol data can be reviewed. | How trust evidence changes user choice or retention. |
Teams building their own evaluation can use the related Hyperliquid public audit as a comparison in method, while keeping protocol-specific conclusions separate.
How to read the evidence score
Each row asks one narrow question: can an outside reviewer observe this growth surface in public material? A score of 2 means the source directly describes or exposes the surface. A score of 1 means a proxy exists, but it leaves a key step unobserved. A score of 0 would mean I found no relevant public evidence in the sources reviewed. These labels do not measure quality, scale, or change over time.
I keep the scores separate because adding them would imply that product, search and retention have equal value and comparable measurement. The brief asks for six named surfaces, but it does not supply a weighting model. A team can use each row to make a focused data request: connect acquisition to source tags, retention to a defined cohort, and search to first-party query and conversion data. That request is more useful than a single unsupported “growth score.”
The total is not a growth score and should not be summed into a ranking. It is a map of what an outside review can substantiate. Product and trust are comparatively observable because the protocol publishes documentation and governance or risk information. Acquisition, retention, search and community outcomes require private analytics or stronger research designs to connect activity to user behavior.
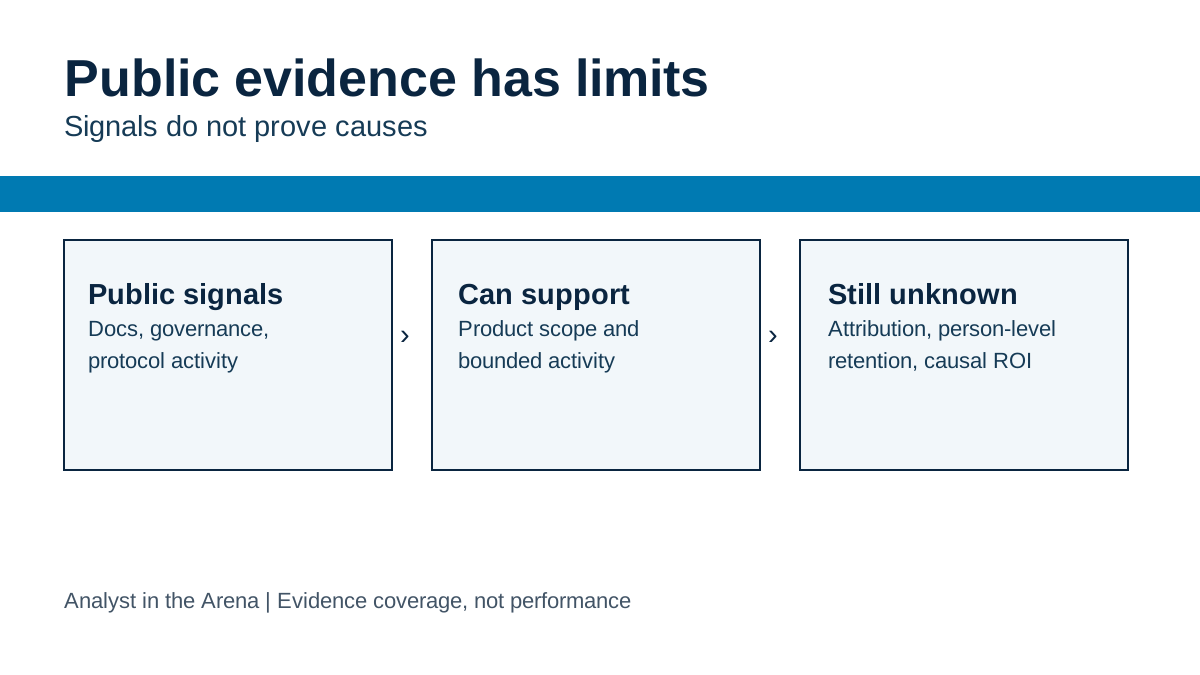
The three biggest leaks in public measurement
Public activity does not identify acquisition source
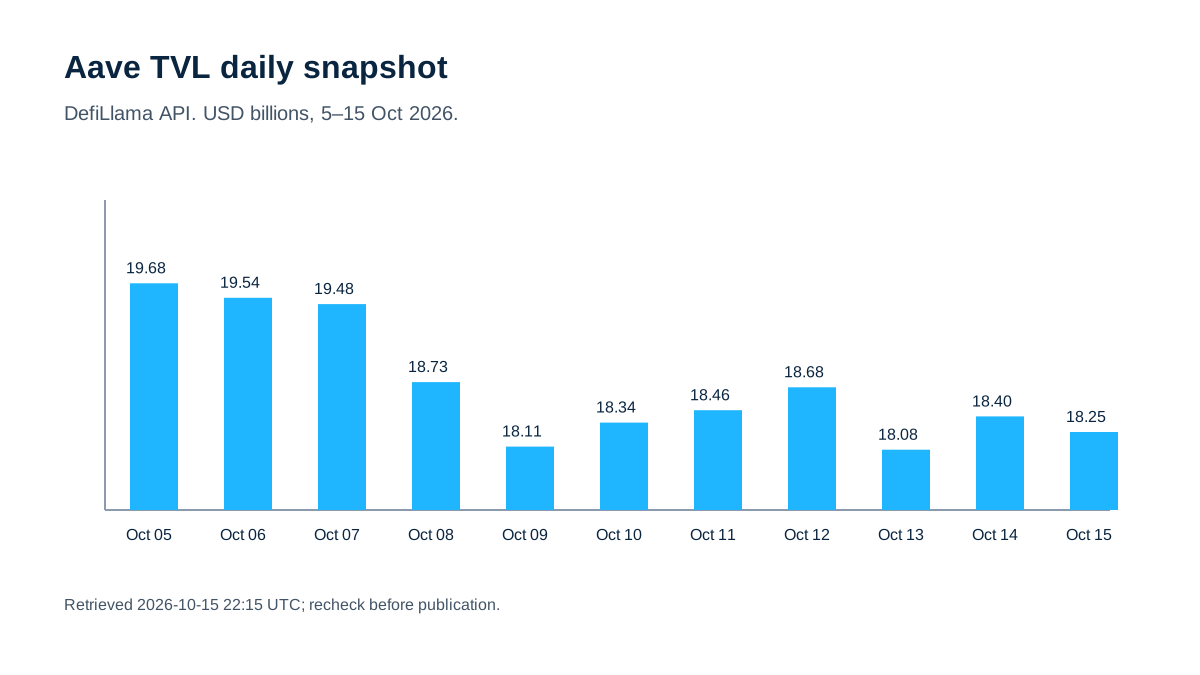
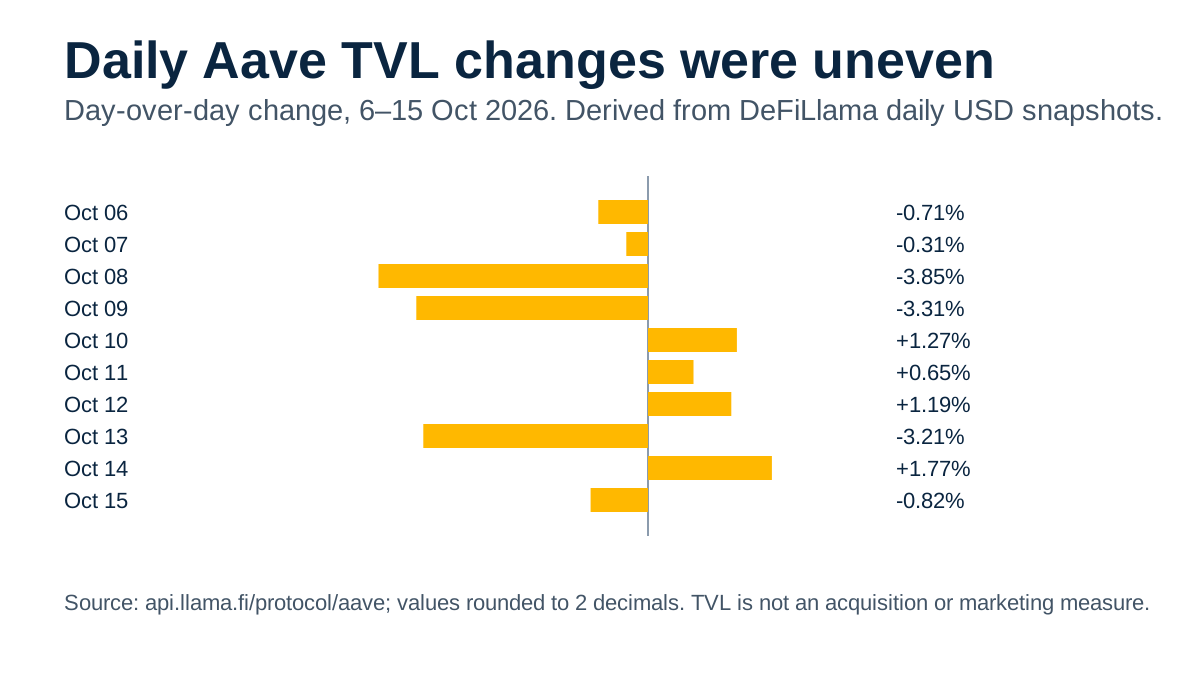
A dashboard can show protocol activity, fees or value supplied under its stated methodology. DeFiLlama’s metric definitions note that TVL can fall even when deposits rise if asset prices fall. Those measures can help describe usage and economic activity. They cannot tell an analyst whether a user arrived through search, a partner, a referral, an incentive, or direct navigation. Without a reliable campaign identifier and a defined conversion event, channel attribution remains unknown.
Even tagged traffic is not proof of causation. A campaign may reach people who would have used the protocol anyway. To estimate incremental impact, a team needs a comparison design, such as a suitable holdout, and must account for market conditions, incentives and cross-channel exposure.
Address activity is not user retention
Repeat transactions can be measured at the address level, but the unit must be stated. A returning address is not necessarily a returning person. A user who changes wallets may look like churn, while a contract or aggregator can make several users appear as one address. Define the event, chain set, cohort start, observation window and treatment of contracts before comparing retention.
A public chart can support a reproducible address-level query. It cannot explain why a user returned or left. First-party product events, wallet-level consented research, support records and carefully designed user interviews answer different questions. They should be joined only under a documented privacy and identity policy.
Documentation visibility is not search performance
Public docs and help pages establish that useful material exists. They do not establish rankings, query demand, search clicks or whether an article assisted a deposit or borrow. Search performance requires Search Console or equivalent first-party data, mapped to landing pages and conversion events. A content inventory is useful for coverage, but it is not a substitute for those outcome measures.
What I would measure in the next 30 days
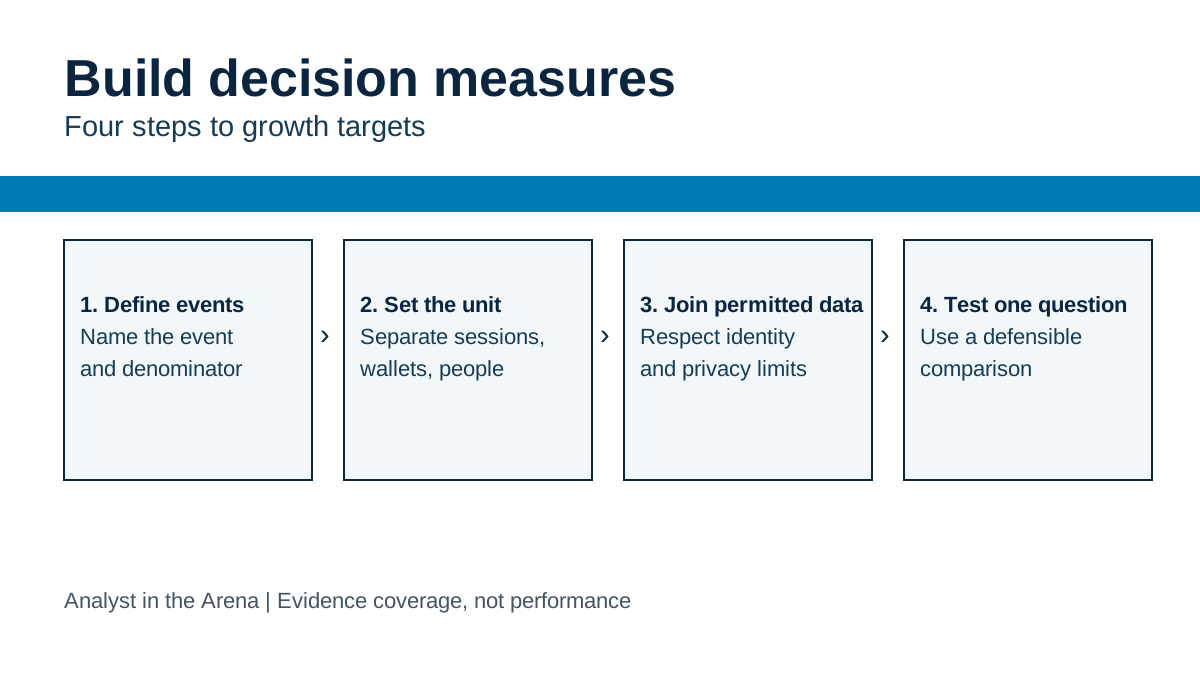
I would begin with definitions, not targets. A target without a stable denominator creates pressure to optimize a number that may not mean what the team thinks it means. The first month should produce a measurement map and a few testable questions, not a fabricated forecast.
- Define the journey. Write down the sequence from first visit to a meaningful product action. For each step, name the event, owner, system of record and known blind spots.
- Separate identities. Distinguish anonymous sessions, connected wallets, addresses, contracts and known people. Do not call addresses “users” unless the measurement method supports that label.
- Document public queries. For each on-chain metric, record the chain, contract set, time window, inclusion rules and query version. Reconcile dashboard labels with the underlying methodology.
- Join permitted first-party data. Connect consented web or product events to campaign tags and on-chain outcomes only where the identity and privacy model allows it. Keep unattributed activity visible.
- Choose one causal question. For example: did a defined education change increase completed first deposits among eligible visitors? Pre-register the cohort, outcome, comparison and time window.
- Report uncertainty. Show sample limits, missing data and market context beside the result. Do not turn correlation into a campaign claim.
This sequence makes the audit useful to a growth lead. It shows what can be answered now and what instrumentation must exist before the team moves budget. It also prevents TVL or token price from becoming a stand-in for acquisition quality. I would review the event definitions with product, analytics and protocol teams before comparing channels, so each group agrees on the same unit and outcome.
FAQ
What does this public Aave growth audit measure?
It measures how much evidence an outside analyst can inspect across product, acquisition, retention, search, community and trust. It does not grade Aave’s growth results or estimate campaign return.
Can public on-chain data prove marketing ROI?
No. It can show activity under a stated query, but it does not identify acquisition source or establish what would have happened without a campaign. ROI needs cost, outcome and a credible attribution or causal method.
Why is TVL not enough to judge acquisition?
TVL is a value measure, not a record of where users came from or why they deposited. It can change with asset prices, deposits, withdrawals and protocol coverage. Treat it as context, not an acquisition outcome.
What first-party data would complete the audit?
Useful inputs include page and product events, campaign identifiers, defined wallet connection and transaction events, cohort rules, support or research feedback, and campaign costs. The team also needs a documented method for privacy, address identity and incrementality.
Closing: use public evidence to choose the next test
Public protocol data is a starting point for better questions. I use this scorecard to mark the boundary between observable activity and decisions that still need first-party evidence. See the Web3 Growth Audit service.
References
- Aave Protocol Documentation, product concepts, risk parameters and developer documentation.
- Aave FAQs, supplier and borrower explanations.
- Aave Governance Documentation, governance structure and proposal process.
- DeFiLlama: Aave, public protocol dashboard.
- DeFiLlama Data Definitions, price effects in TVL interpretation.
- Ethereum Accounts, externally owned and contract accounts.
- Bank for International Settlements, Towards verifiability of total value locked, published May 14, 2025; discussion of limits in TVL measurement.